As Inverted Product Managers, we face a unique measuring problem. We don’t know how much badness is out there. In this post, I discuss the concept of the invisible line and its consequences for Product Managers.
I am an Inverted Product Manager (PM). Inverted PMs work on problems like security, abuse, infrastructure where our success is when nothing happens. Abuse is avoided. Our strategy is different, the way we communicate is different, our users are different and our metrics are different. All of this has consequences for how we work. Read the original post if you haven’t already. In this post, I go deeper into one of the concepts: The Invisible line .
Defining The Invisible Line
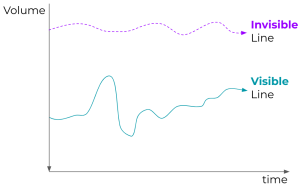
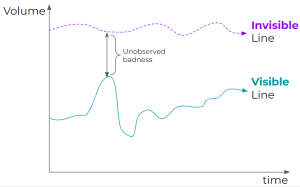
As Inverted PMs, we do not know how much badness there is in the world. We do not know how many accounts are being compromised, how many bad videos are uploaded, how many unwanted items are in our store. Because whenever we find a piece of badness, we act. We take it down. We act on the spammer. But the reality is that we don’t know the real volume of the badness that is out there. This is the invisible line, the real amount of badness out there. It consists of 2 parts: The Invisible badness you do not (yet) detect, and the visible part which is equally important.


The invisible part of the invisible line
Why can’t we know the real volume of the badness out there? Several reasons lead to badness being invisible:
- Bad actors remove the good actor from the account so you never learn about it.
- The abuse is embarrassing so the victim never reports it.
- An abusive campaign has the specific goal to avoid detection so it does for example low-volume abuse.
- It might be the first time for this specific abuse so you don’t detect it.
- Abusers have found a flow through your system that you have not yet protected.
The Visible part of the Invisible line
Not all the badness is invisible. Your systems detect some abuse, and your users report it. Then you might act on it in different ways depending on how confident you are whether a specific thing is malicious you might act stronger or more reserved. But regardless of how you act, every piece of badness you detect becomes part of your visible line.
It’s good news that at least part of the badness out there is visible. It all starts with a detection system that produces a metric counting the visible badness. Perhaps you are just starting out and only have customer reports for example, then developing that metric should be your first start. But once you have the visible line, the challenge begins.

The challenge of changes in the Visible line
Say you launch a new feature to prevent badness but the visible line moves up. Did you and your team do a bad job? Not necessarily. The real badness might just have become more visible because you have launched better detection systems. So even though you’ve launched a successful new feature, the visible line moved up.
The reverse can be true as well. The visible line might have gone down and you call it a success. But it might be that your newly launched prevention measure didn’t actually help much. It’s just that the bad actors have given up, resulting in the invisible line having gone down. Abusers might have had other reasons to move away, or the abuse has just moved outside of your detection system.

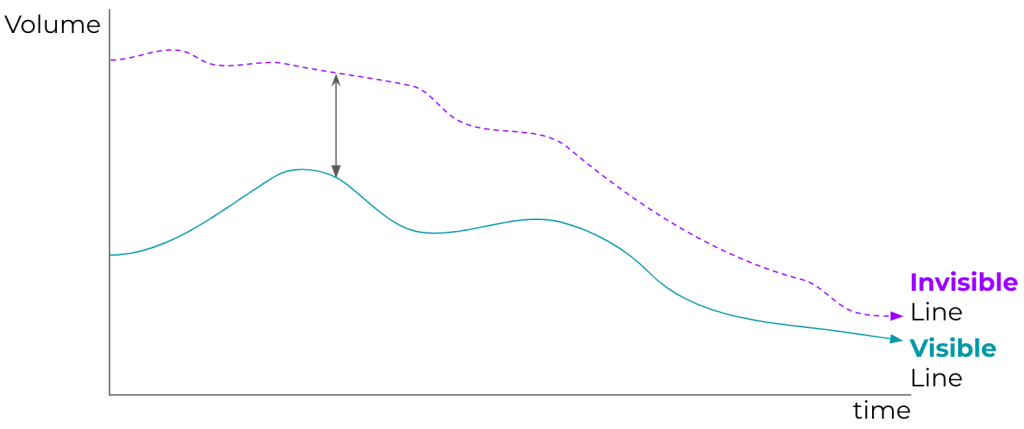
The movement in the visible isn’t 100% correlated with your success as an inverted PM. This is something you should be aware of and help others understand. So what should your goal be then? Aim for convergence of the visible and invisible lines but at the same time accept that we will never get there.
Measuring your impact
Even though your problem space deals with the invisible line, you can still show impact through A/B testing. Say you create a new algorithm to prevent bad content from being uploaded. Here is how you could measure impact:
- Deploy it to 50% of users based on some kind of identifier that the attackers don’t know.
- Wait a little while but not too long since then the attackers might adapt.
- Measure the difference and you can hypothesize that a launch for example reduced bad content uploads by X%.
- The caveat is that it’s for that type of bad content, at that time, for that modus operandi of abusers.
So it’s not perfect but will explain the impact of that prevention measure which was the hard work of your team.
Perhaps you feel bad for not immediately rolling out to all your users, and sometimes you should do that. But this algorithm wasn’t there before, by withholding it a few days or weeks you’re not making the world worse. Demonstrating impact helps tell the story of your team allowing more impact in the future.
At the end of the year, you can make a “waterfall” graph showing your launches. Start with the visible line at the beginning of the year and end with the visible line at the end of the year. Then, show your launches in between. Show the improvements in detection that increased the visible line but also improvements in preventions that reduced it. This will tell your impact story for the year.
The Goal: Convergence
In the long run, the visible and invisible lines should move towards each other until the visible line is almost on top of the invisible line. This means you detect most badness (high recall) and act on all of it. Then ideally those 2 lines start moving down together towards zero. You have to accept that these lines will never be completely on top of each other nor reach 0, which is part of our world.

How will you know that you are converging the line? I advise you to develop multiple independent sensor metrics that detect some part of the visible line (customer escalations, industry research, manual reviews etc). If one of these “sensor metrics” goes up and you haven’t launched something, there might be a new thing to investigate. How often this happens, and how bad it is when it does, will give you an indicator of how well your product is performing vs the invisible line. Your “sensors” also give you an idea of how to prioritize. If you have “users screaming” in your forums this might merit more investment than an un-exploited vulnerability discovered in a penetration test.
Dealing with the invisible
So what should you do? If you are an end-user, keep hitting that “mark as spam” button in any product you use. It helps us inverted PMs and our teams to find more badness and take it down.
If you are an Inverted PM there are a number of things you could consider:
- Explain the invisible line to your stakeholders. Prepare them for the fact that new badness will pop up.
- Educate your stakeholders about the visible line, and the movements there that come with a story.
- Try to find sources of intelligence indicating how far apart the visible and invisible lines are.
- Measure launches through A/B experiments so you can show the impact and tell the story.
Saving one is worth it
As Inverted PMs, we have to live with the reality of the invisible line. We should never lose excitement for our work around removing bad content, preventing account hijackings or preventing dollar loss. Your launches have an impact even when their effects aren’t fully visible. Saving one is always worth it… even when they are invisible
Feature image by Oscar Keys on Unsplash


